
Page 60 - FOR FLIP BOOK [single page]Cluster report 2018-2020 (1)
P. 60
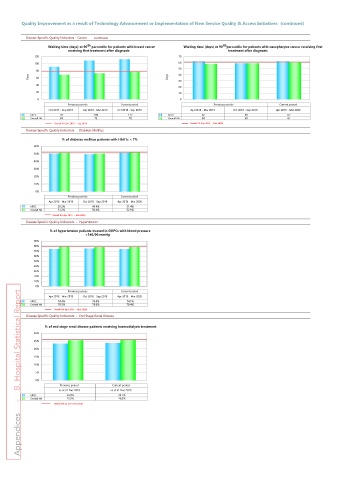
Quality Improvement as a result of Technology Advancement or Implementation of New Service Quality & Access Initiatives  (continued)


          Disease Specific Quality Indicators - Cancer   (continued)
                                                                               th
                                th
                  Waiting time (days) at 90  percentile for patients with breast cancer  Waiting time (days) at 90  percentile for patients with nasopharynx cancer receiving first
                         receiving first treatment after diagnosis               treatment after diagnosis
               120                                               70
               100                                               60
                                                                 50
               80
           Days    60                                       Days    40
                                                                 30
               40
                                                                 20
               20                                                10
                0                                                 0
                         Previous periods  Current period                   Previous periods       Current period
                  Oct 2017 - Sep 2018  Apr 2018 - Mar 2019  Oct 2018 - Sep 2019  Apr 2018 - Mar 2019  Oct 2018 - Sep 2019  Apr 2019 - Mar 2020
            NTEC       91          109         112          NTEC         62             59             62
            Overall HA   69        73          78           Overall HA   58             59             61
                    Overall HA (Oct 2018  - Sep 2019)               Overall HA (Apr 2019  - Mar 2020)
          Disease Specific Quality Indicators  -  Diabetes Mellitus
                       % of diabetes mellitus patients with HbA1c < 7%
             60%
             50%
             40%
             30%
             20%
             10%
             0%
                         Previous periods  Current period
                  Apr 2018 - Mar 2019  Oct 2018 - Sep 2019  Apr 2019 - Mar 2020
            NTEC      50.2%       49.4%       51.4%
            Overall HA   51.2%    50.3%       52.3%
                   Overall HA (Apr 2019  - Mar 2020)
          Disease Specific Quality Indicators  -  Hypertension
                   % of hypertension patients treated in GOPCs with blood pressure
                               <140/90 mmHg
             90%
             80%
             70%
             60%
             50%
             40%
             30%
             20%
             10%
             0%
                         Previous periods  Current period
         Appendices     -    B. Hospital Statistical Report
                  Apr 2018 - Mar 2019  Oct 2018 - Sep 2019  Apr 2019 - Mar 2020
            NTEC      74.4%       74.8%       74.1%
            Overall HA   79.5%    78.6%       78.4%
                    Overall HA (Apr 2019  - Mar 2020)
          Disease Specific Quality Indicators  -  End Stage Renal Disease
                 % of end stage renal disease patients receiving haemodialysis treatment
             30%
             25%
             20%
             15%
             10%
             5%
             0%
                      Previous period   Current period
                      as at 31 Dec 2018  as at 31 Dec 2019
            NTEC         23.3%             23.7%
            Overall HA   25.5%             26.0%
                    Overall HA (as at 31 Dec 2019)