Page 65 - FOR FLIP BOOK [single page]Cluster report 2018-2020 (1)
P. 65

65
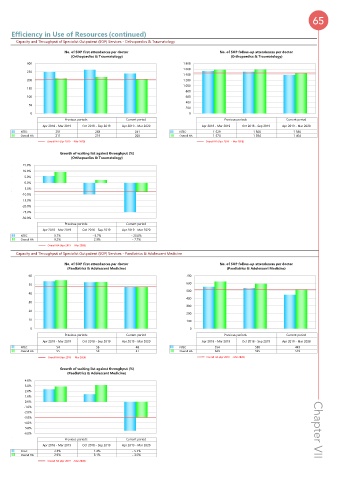
     Efficiency in Use of Resources (continued)
       Capacity and Throughput of Specialist Outpatient (SOP) Services - Orthopaedics & Traumatology

                        No. of SOP first attendances per doctor               No. of SOP follow-up attendances per doctor
                          (Orthopaedics & Traumatology)                           (Orthopaedics & Traumatology)
            300                                                   1 800
                                                                  1 600
            250
                                                                  1 400
            200                                                   1 200
                                                                  1 000
            150
                                                                    800
            100                                                     600
                                                                    400
             50
                                                                    200
             0                                                       0
                        Previous periods     Current period                     Previous periods      Current period
                Apr 2018 - Mar 2019  Oct 2018 - Sep 2019  Apr 2019 - Mar 2020  Apr 2018 - Mar 2019  Oct 2018 - Sep 2019  Apr 2019 - Mar 2020
        NTEC          251           263           241           NTEC         1 529         1 508         1 386
        Overall HA    211           219           206           Overall HA   1 574         1 584         1 464
                  Overall HA (Apr 2019  - Mar 2020)                      Overall HA (Apr 2019  - Mar 2020)
                  Overall HA (Apr 2019  - Mar 2020)
                                                                         Overall HA (Apr 2019  - Mar 2020)
                      Growth of waiting list against throughput (%)
                          (Orthopaedics & Traumatology)
         15.0%
         10.0%
          5.0%
          0.0%
         -5.0%
         -10.0%
         -15.0%
         -20.0%
         -25.0%
         -30.0%
                        Previous periods     Current period
                Apr 2018 - Mar 2019  Oct 2018 - Sep 2019  Apr 2019 - Mar 2020
        NTEC         5.7%         - 9.7%       - 25.0%
        Overall HA   9.2%          2.3%        - 7.7%
                  Overall HA (Apr 2019  - Mar 2020)
                  Overall HA (Apr 2019  - Mar 2020)
       Capacity and Throughput of Specialist Outpatient (SOP) Services - Paediatrics & Adolescent Medicine
                        No. of SOP first attendances per doctor               No. of SOP follow-up attendances per doctor
                         (Paediatrics & Adolescent Medicine)                     (Paediatrics & Adolescent Medicine)
             60                                                     700
             50                                                     600
                                                                    500
             40
                                                                    400
             30
                                                                    300
             20
                                                                    200
             10                                                     100
             0                                                       0
                        Previous periods     Current period                     Previous periods      Current period
                Apr 2018 - Mar 2019  Oct 2018 - Sep 2019  Apr 2019 - Mar 2020  Apr 2018 - Mar 2019  Oct 2018 - Sep 2019  Apr 2019 - Mar 2020
        NTEC          54            53            48            NTEC          554           538           449
        Overall HA    55            53            47            Overall HA    623           595           519
                  Overall HA (Apr 2019  - Mar 2020)                       Overall HA (Apr 2019  - Mar 2020)
                      Growth of waiting list against throughput (%)
                         (Paediatrics & Adolescent Medicine)
          4.0%
          3.0%
          2.0%
          1.0%
          0.0%
         -1.0%
         -2.0%
         -3.0%
         -4.0%
         -5.0%                                                                                                 Chapter VII
         -6.0%
                        Previous periods     Current period
                Apr 2018 - Mar 2019  Oct 2018 - Sep 2019  Apr 2019 - Mar 2020
        NTEC         2.3%          1.4%        - 5.5%
        Overall HA   2.9%          3.1%        - 3.0%
                  Overall HA (Apr 2019  - Mar 2020)
   60   61   62   63   64   65   66   67   68   69   70