Page 64 - FOR FLIP BOOK [single page]Cluster report 2018-2020 (1)
P. 64

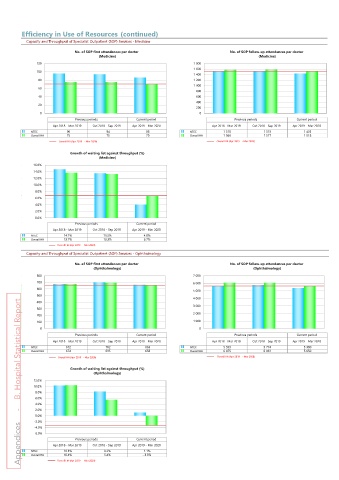
Efficiency in Use of Resources (continued)
          Capacity and Throughput of Specialist Outpatient (SOP) Services - Medicine

                           No. of SOP first attendances per doctor                No. of SOP follow-up attendances per doctor
                                    (Medicine)                                              (Medicine)
               120                                                    1 800
                                                                      1 600
               100
                                                                      1 400
                80                                                    1 200
                                                                      1 000
                60
                                                                       800
                40                                                     600
                                                                       400
                20
                                                                       200
                 0                                                       0
                           Previous periods      Current period                    Previous periods      Current period
                    Apr 2018 - Mar 2019  Oct 2018 - Sep 2019  Apr 2019 - Mar 2020  Apr 2018 - Mar 2019  Oct 2018 - Sep 2019  Apr 2019 - Mar 2020
            NTEC          96            94            86            NTEC        1 516         1 515         1 435
            Overall HA    75            75            70            Overall HA   1 566        1 577         1 518
                      Overall HA (Apr 2019  - Mar 2020)                      Overall HA (Apr 2019  - Mar 2020)
                          Growth of waiting list against throughput (%)
                                    (Medicine)
             16.0%
             14.0%
             12.0%
             10.0%
             8.0%
             6.0%
             4.0%
             2.0%
             0.0%
                           Previous periods      Current period
                    Apr 2018 - Mar 2019  Oct 2018 - Sep 2019  Apr 2019 - Mar 2020
            NTEC        14.7%         13.5%         4.0%
            Overall HA   13.7%        13.3%         6.7%
                     Overall HA (Apr 2019  - Mar 2020)
          Capacity and Throughput of Specialist Outpatient (SOP) Services - Ophthalmology
                           No. of SOP first attendances per doctor                No. of SOP follow-up attendances per doctor
                                  (Ophthalmology)                                         (Ophthalmology)
               800                                                    7 000
               700                                                    6 000
               600
                                                                      5 000
               500
                                                                      4 000
         Appendices     -    B. Hospital Statistical Report
               400
                                                                      3 000
               300
                                                                      2 000
               200
               100                                                    1 000
                 0                                                      0
                           Previous periods      Current period                    Previous periods      Current period
                    Apr 2018 - Mar 2019  Oct 2018 - Sep 2019  Apr 2019 - Mar 2020  Apr 2018 - Mar 2019  Oct 2018 - Sep 2019  Apr 2019 - Mar 2020
            NTEC          672          702           663            NTEC        5 599         5 774         5 360
            Overall HA    674          695           658            Overall HA   6 075        6 061         5 650
                     Overall HA (Apr 2019  - Mar 2020)                       Overall HA (Apr 2019  - Mar 2020)
                          Growth of waiting list against throughput (%)
                                  (Ophthalmology)
             12.0%
             10.0%
             8.0%
             6.0%
             4.0%
             2.0%
             0.0%
             -2.0%
             -4.0%
             -6.0%
                           Previous periods      Current period
                    Apr 2018 - Mar 2019  Oct 2018 - Sep 2019  Apr 2019 - Mar 2020
            NTEC        10.3%         8.2%          1.1%
            Overall HA   10.4%        5.4%         - 3.3%
                     Overall HA (Apr 2019  - Mar 2020)
   59   60   61   62   63   64   65   66   67   68   69