
Page 58 - FOR FLIP BOOK [single page]Cluster report 2018-2020 (1)
P. 58
Current period Previous period
NTEC Overall HA Variance from NTEC
Apr 2019 - Mar 2020 Overall HA Apr 2018 - Mar 2019 Variance
A B C = (A - B) or D E = (A - D) or
(A - B) / B (A - D) / D
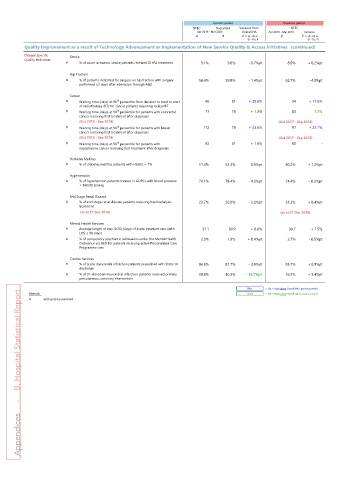
Quality Improvement as a result of Technology Advancement or Implementation of New Service Quality & Access Initiatives (continued)
Disease Specific Stroke
Quality Indicators
# % of acute ischaemic stroke patients received IV tPA treatment 9.1% 9.8% - 0.7%pt 8.9% + 0.2%pt
Hip Fracture
# % of patients indicated for surgery on hip fracture with surgery 58.4% 59.8% - 1.4%pt 62.7% - 4.3%pt
performed ≤ 2 days after admission through A&E
Cancer
# Waiting time (days) at 90 percentile from decision to treat to start 40 31 + 29.0% 34 + 17.6%
th
of radiotherapy (RT) for cancer patients requiring radical RT
# Waiting time (days) at 90 percentile for patients with colorectal 77 76 + 1.3% 83 - 7.2%
th
cancer receiving first treatment after diagnosis
(Oct 2018 - Sep 2019) (Oct 2017 - Sep 2018)
th
# Waiting time (days) at 90 percentile for patients with breast 112 78 + 43.6% 91 + 23.1%
cancer receiving first treatment after diagnosis
(Oct 2018 - Sep 2019) (Oct 2017 - Sep 2018)
th
# Waiting time (days) at 90 percentile for patients with 62 61 + 1.6% 62 -
nasopharynx cancer receiving first treatment after diagnosis
Diabetes Mellitus
# % of diabetes mellitus patients with HbA1c < 7% 51.4% 52.3% - 0.9%pt 50.2% + 1.2%pt
Hypertension
# % of hypertension patients treated in GOPCs with blood pressure 74.1% 78.4% - 4.3%pt 74.4% - 0.3%pt
< 140/90 mmHg
End Stage Renal Disease
# % of end stage renal disease patients receiving haemodialysis 23.7% 26.0% - 2.3%pt 23.3% + 0.4%pt
treatment
(as at 31 Dec 2019) (as at 31 Dec 2018)
Mental Health Services
# Average length of stay (LOS) (days) of acute inpatient care (with 31.1 30.9 + 0.6% 30.7 + 1.5%
LOS ≤ 90 days)
# % of compulsory psychiatric admissions under the Mental Health 2.3% 1.9% + 0.4%pt 2.7% - 0.5%pt
Ordinance via AED for patients receiving active Personalised Care
Programme care
Cardiac Services
# % of acute myocardial infarction patients prescribed with Statin at 84.6% 87.7% - 3.0%pt 83.7% + 0.9%pt
discharge
# % of ST-elevation myocardial infarction patients received primary 19.6% 36.3% - 16.7%pt 16.2% + 3.4%pt
percutaneous coronary intervention
Blue > 5% / 5%pt above Overall HA / previous period
Appendices - B. Hospital Statistical Report
Remark: Green > 5% / 5%pt below Overall HA / previous period
# with graph presented