
Page 56 - FOR FLIP BOOK [single page]Cluster report 2018-2020 (1)
P. 56
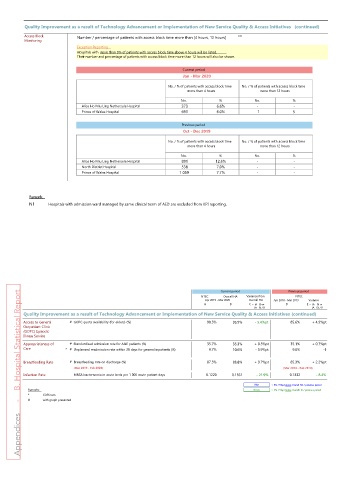
Quality Improvement as a result of Technology Advancement or Implementation of New Service Quality & Access Initiatives  (continued)
          Access Block      Number / percentage of patients with access block time more than [4 hours, 12 hours]   N1
          Monitoring
                            Exception Reporting
                            Hospitals with more than 5% of patients with access block time above 4 hours will be listed.
                            Their number and percentage of patients with access block time more than 12 hours will also be shown.

                                                                 Current period
                                                                 Jan - Mar 2020
                                                            No. / % of patients with access block time  No. / % of patients with access block time
                                                                   more than 4 hours        more than 12 hours

                                                                 No.          %           No.           %
                              Alice Ho Miu Ling Nethersole Hospital    373    6.6%         -            -
                              Prince of Wales Hospital            693         6.0%           1          §

                                                                 Previous period
                                                                 Oct - Dec 2019
                                                            No. / % of patients with access block time  No. / % of patients with access block time
                                                                   more than 4 hours        more than 12 hours

                                                                 No.          %           No.           %
                              Alice Ho Miu Ling Nethersole Hospital    891   12.6%         -            -
                              North District Hospital             538         7.0%         -            -
                              Prince of Wales Hospital           1 059        7.7%         -            -


           Remark:
           N1        Hospitals with admission ward managed by same clinical team of AED are excluded from KPI reporting.


                                                                               Current period         Previous period
         Appendices     -    B. Hospital Statistical Report
                                                                        NTEC   Overall HA  Variance from  NTEC
                                                                         Apr 2019 - Mar 2020  Overall HA  Apr 2018 - Mar 2019  Variance
                                                                         A        B      C = (A - B) or  D   E = (A - D) or
                                                                                                 (A - B) / B           (A - D) / D
         Quality Improvement as a result of Technology Advancement or Implementation of New Service Quality & Access Initiatives (continued)
         Access to General  # GOPC quota availability (for elders) (%)    90.5%    95.9%   - 5.4%pt     85.6%  + 4.9%pt
         Outpatient Clinic
         (GOPC) Episodic
         Illness Service
         Appropriateness of  # Standardised admission rate for A&E patients (%)   35.7%   35.3%  + 0.5%pt   35.1%  + 0.7%pt
         Care           * # Unplanned readmission rate within 28 days for general inpatients (%)   9.7%   10.6%  - 0.9%pt   9.8%  -§

         Breastfeeding Rate  # Breastfeeding rate on discharge (%)        87.5%    83.8%  + 3.7%pt      85.3%  + 2.2%pt
                           (Mar 2019 - Feb 2020)                                                    (Mar 2018 - Feb 2019)
         Infection Rate    MRSA bacteraemia in acute beds per 1 000 acute patient days   0.1220   0.1561  - 21.9%   0.1332  - 8.4%
                                                                                          Blue    > 5% / 5%pt above Overall HA / previous period
           Remarks:                                                                       Green    > 5% / 5%pt below Overall HA / previous period
           *         COR item
           #         with graph presented