
Page 62 - FOR FLIP BOOK [single page]Cluster report 2018-2020 (1)
P. 62
Current period Previous period
NTEC Overall HA Variance from NTEC
Apr 2019 - Mar 2020 Overall HA Apr 2018 - Mar 2019 Variance
A B C = (A - B) or D E = (A - D) or
(A - B) / B (A - D) / D
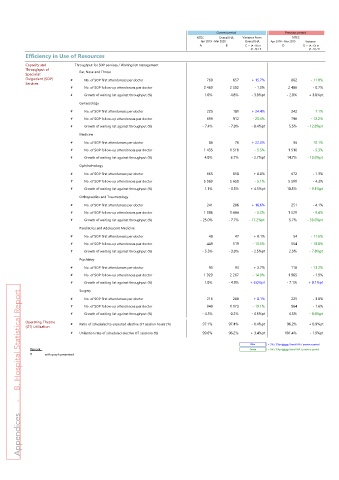
Efficiency in Use of Resources
Capacity and Throughput for SOP services / Waiting list management
Throughput of Ear, Nose and Throat
Specialist
Outpatient (SOP) # No. of SOP first attendances per doctor 760 657 + 15.7% 862 - 11.8%
Services
# No. of SOP follow-up attendances per doctor 2 469 2 502 - 1.3% 2 486 - 0.7%
# Growth of waiting list against throughput (%) 1.0% 4.8% - 3.8%pt - 2.0% + 3.0%pt
Gynaecology
# No. of SOP first attendances per doctor 225 181 + 24.4% 242 - 7.1%
# No. of SOP follow-up attendances per doctor 699 912 - 23.4% 796 - 12.2%
# Growth of waiting list against throughput (%) - 7.4% - 7.0% - 0.4%pt 5.5% - 12.8%pt
Medicine
# No. of SOP first attendances per doctor 86 70 + 22.3% 96 - 10.1%
# No. of SOP follow-up attendances per doctor 1 435 1 518 - 5.5% 1 516 - 5.3%
# Growth of waiting list against throughput (%) 4.0% 6.7% - 2.7%pt 14.7% - 10.6%pt
Ophthalmology
# No. of SOP first attendances per doctor 663 658 + 0.8% 672 - 1.3%
# No. of SOP follow-up attendances per doctor 5 360 5 650 - 5.1% 5 599 - 4.3%
# Growth of waiting list against throughput (%) 1.1% - 3.3% + 4.5%pt 10.3% - 9.1%pt
Orthopaedics and Traumatology
# No. of SOP first attendances per doctor 241 206 + 16.6% 251 - 4.1%
# No. of SOP follow-up attendances per doctor 1 386 1 464 - 5.3% 1 529 - 9.4%
# Growth of waiting list against throughput (%) - 25.0% - 7.7% - 17.2%pt 5.7% - 30.6%pt
Paediatrics and Adolescent Medicine
# No. of SOP first attendances per doctor 48 47 + 0.1% 54 - 11.6%
# No. of SOP follow-up attendances per doctor 449 519 - 13.5% 554 - 18.8%
# Growth of waiting list against throughput (%) - 5.5% - 3.0% - 2.5%pt 2.3% - 7.8%pt
Psychiatry
# No. of SOP first attendances per doctor 95 93 + 2.7% 110 - 13.2%
# No. of SOP follow-up attendances per doctor 1 929 2 267 - 14.9% 1 965 - 1.9%
# Growth of waiting list against throughput (%) 1.0% - 4.9% + 6.0%pt - 7.1% + 8.1%pt
Surgery
Appendices - B. Hospital Statistical Report
# No. of SOP first attendances per doctor 216 200 + 8.1% 225 - 3.8%
# No. of SOP follow-up attendances per doctor 949 1 173 - 19.1% 964 - 1.6%
# Growth of waiting list against throughput (%) - 4.3% 0.2% - 4.5%pt 4.3% - 8.6%pt
Operating Theatre # Ratio of scheduled to expected elective OT session hours (%) 97.1% 97.4% - 0.4%pt 96.2% + 0.9%pt
(OT) Utilisation
# Utilisation rate of scheduled elective OT sessions (%) 99.6% 96.2% + 3.4%pt 101.4% - 1.9%pt
Blue > 5% / 5%pt above Overall HA / previous period
Remark: Green > 5% / 5%pt below Overall HA / previous period
# with graph presented