Page 55 - FOR FLIP BOOK [single page]Cluster report 2018-2020 (1)
P. 55

55


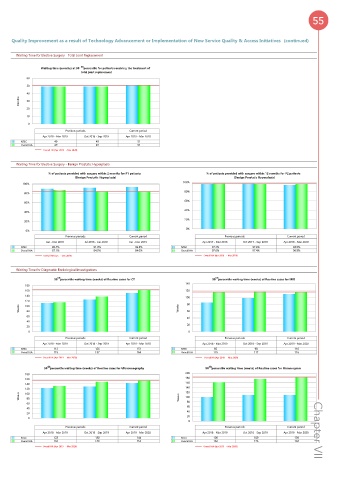
     Quality Improvement as a result of Technology Advancement or Implementation of New Service Quality & Access Initiatives  (continued)


       Waiting Time for Elective Surgery - Total Joint Replacement
               Waiting time (months) at 90  th  percentile for patients receiving the treatment of
                             total joint replacement
          60
          50
          40
        Months  30
          20
          10
           0
                        Previous periods      Current period
                Apr 2018 - Mar 2019  Oct 2018 - Sep 2019  Apr 2019 - Mar 2020
        NTEC         49            49             51
        Overall HA   49            49             51
                Overall HA (Apr 2019  - Mar 2020)

       Waiting Time for Elective Surgery - Benign Prostatic Hyperplasia
                  % of patients provided with surgery within 2 months for P1 patients  % of patients provided with surgery within 12 months for P2 patients
                           (Benign Prostatic Hyperplasia)                          (Benign Prostatic Hyperplasia)
                                                                 100%
         100%
                                                                  80%
          80%
                                                                  60%
          60%
                                                                  40%
          40%
                                                                  20%
          20%
                                                                  0%
          0%
                        Previous periods      Current period                    Previous periods      Current period
                 Jan - Dec 2018  Jul 2018 - Jun 2019  Jan - Dec 2019    Apr 2017 - Mar 2018  Oct 2017 - Sep 2018  Apr 2018 - Mar 2019
        NTEC        89.4%          91.8%         93.3%           NTEC       97.4%         97.6%          93.9%
        Overall HA   87.1%         84.3%         84.0%           Overall HA   97.6%       97.4%          96.9%
                Overall HA (Jan  - Dec 2019)                             Overall HA (Apr 2018  - Mar 2019)

       Waiting Time for Diagnostic Radiological Investigations
                     th
                                                                             th
                    90  percentile waiting time (weeks) of Routine cases for CT  90  percentile waiting time (weeks) of Routine cases for MRI
                                                                  140
          180
          160                                                     120
          140
                                                                  100
          120
                                                                   80
          100
        Weeks  80                                               Weeks  60
          60
                                                                   40
          40
                                                                   20
          20
           0                                                       0
                        Previous periods      Current period                    Previous periods      Current period
                Apr 2018 - Mar 2019  Oct 2018 - Sep 2019  Apr 2019 - Mar 2020  Apr 2018 - Mar 2019  Oct 2018 - Sep 2019  Apr 2019 - Mar 2020
        NTEC         112           126            151            NTEC        85            98            110
        Overall HA   115           137            164            Overall HA   115          117           116
                Overall HA (Apr 2019  - Mar 2020)                        Overall HA (Apr 2019  - Mar 2020)
                                                                          th
                  th
                 90  percentile waiting time (weeks) of Routine cases for Ultrasonography  90  percentile waiting time (weeks) of Routine cases for Mammogram
          180                                                     200
          160                                                     180
          140                                                     160
          120                                                     140
                                                                  120
          100
        Weeks  80                                               Weeks  100
          60                                                       80
          40                                                       60
          20                                                       40
           0                                                       20
                                                                   0
                        Previous periods      Current period                    Previous periods      Current period
                Apr 2018 - Mar 2019  Oct 2018 - Sep 2019  Apr 2019 - Mar 2020  Apr 2018 - Mar 2019  Oct 2018 - Sep 2019  Apr 2019 - Mar 2020  Chapter VII
        NTEC         123           130            144            NTEC        100           109           109
        Overall HA   132           149            155            Overall HA   162          176           184
                Overall HA (Apr 2019  - Mar 2020)                       Overall HA (Apr 2019  - Mar 2020)
   50   51   52   53   54   55   56   57   58   59   60