Page 66 - FOR FLIP BOOK [single page]Cluster report 2018-2020 (1)
P. 66

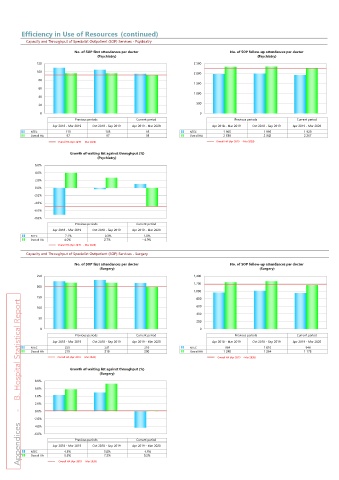
Efficiency in Use of Resources (continued)
          Capacity and Throughput of Specialist Outpatient (SOP) Services - Psychiatry

                           No. of SOP first attendances per doctor                No. of SOP follow-up attendances per doctor
                                   (Psychiatry)                                            (Psychiatry)
               120                                                    2 500
               100                                                    2 000
                80
                                                                      1 500
                60
                                                                      1 000
                40
                20                                                     500
                 0                                                       0
                           Previous periods      Current period                    Previous periods      Current period
                    Apr 2018 - Mar 2019  Oct 2018 - Sep 2019  Apr 2019 - Mar 2020  Apr 2018 - Mar 2019  Oct 2018 - Sep 2019  Apr 2019 - Mar 2020
            NTEC         110           105            95            NTEC        1 965         1 995         1 929
            Overall HA    97            97            93            Overall HA   2 338        2 342         2 267
                     Overall HA (Apr 2019  - Mar 2020)                       Overall HA (Apr 2019  - Mar 2020)
                          Growth of waiting list against throughput (%)
                                   (Psychiatry)
             6.0%
             4.0%
             2.0%
             0.0%
             -2.0%
             -4.0%
             -6.0%
             -8.0%
                           Previous periods      Current period
                    Apr 2018 - Mar 2019  Oct 2018 - Sep 2019  Apr 2019 - Mar 2020
            NTEC       - 7.1%        - 0.3%         1.0%
            Overall HA   4.0%         2.7%         - 4.9%
                     Overall HA (Apr 2019  - Mar 2020)
          Capacity and Throughput of Specialist Outpatient (SOP) Services - Surgery
                           No. of SOP first attendances per doctor                No. of SOP follow-up attendances per doctor
                                    (Surgery)                                               (Surgery)
              250                                                    1,400
                                                                     1,200
              200
                                                                     1,000
              150                                                     800
         Appendices     -    B. Hospital Statistical Report
              100                                                     600
                                                                      400
               50
                                                                      200
               0                                                       0
                           Previous periods      Current period                    Previous periods      Current period
                    Apr 2018 - Mar 2019  Oct 2018 - Sep 2019  Apr 2019 - Mar 2020  Apr 2018 - Mar 2019  Oct 2018 - Sep 2019  Apr 2019 - Mar 2020
            NTEC        225           231           216             NTEC         964          1 010           949
            Overall HA  219           218           200             Overall HA   1 240        1 264         1 173
                     Overall HA (Apr 2019  - Mar 2020)                       Overall HA (Apr 2019  - Mar 2020)
                          Growth of waiting list against throughput (%)
                                    (Surgery)
             8.0%
             6.0%
             4.0%
             2.0%
             0.0%
             -2.0%
             -4.0%
             -6.0%
                           Previous periods      Current period
                    Apr 2018 - Mar 2019  Oct 2018 - Sep 2019  Apr 2019 - Mar 2020
            NTEC        4.3%          5.0%         - 4.3%
            Overall HA   5.8%         7.3%          0.2%
                      Overall HA (Apr 2019  - Mar 2020)
   61   62   63   64   65   66   67   68   69   70   71