
Page 54 - FOR FLIP BOOK [single page]Cluster report 2018-2020 (1)
P. 54
Current period Previous period
NTEC Overall HA Variance from NTEC
Apr 2019 - Mar 2020 Overall HA Apr 2018 - Mar 2019 Variance
A B C = (A - B) or D E = (A - D) or
(A - B) / B (A - D) / D
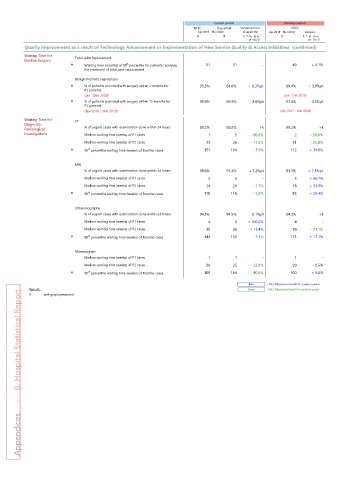
Quality Improvement as a result of Technology Advancement or Implementation of New Service Quality & Access Initiatives (continued)
Waiting Time for Total Joint Replacement
Elective Surgery
# Waiting time (months) at 90 percentile for patients receiving 51 51 - 49 + 4.1%
th
the treatment of total joint replacement
Benign Prostatic Hyperplasia
# % of patients provided with surgery within 2 months for 93.3% 84.0% + 9.3%pt 89.4% + 3.9%pt
P1 patients
(Jan - Dec 2019) (Jan - Dec 2018)
# % of patients provided with surgery within 12 months for 93.9% 96.9% - 3.0%pt 97.4% - 3.5%pt
P2 patients
(Apr 2018 - Mar 2019) (Apr 2017 - Mar 2018)
Waiting Time for CT
Diagnostic
Radiological % of urgent cases with examination done within 24 hours 99.2% 99.2% +§ 99.2% +§
Investigations Median waiting time (weeks) of P1 cases 1 5 - 80.0% 2 - 50.0%
Median waiting time (weeks) of P2 cases 23 26 - 11.5% 31 - 25.8%
# 90 percentile waiting time (weeks) of Routine cases 151 164 - 7.9% 112 + 34.8%
th
MRI
% of urgent cases with examination done within 24 hours 98.6% 97.4% + 1.2%pt 91.3% + 7.3%pt
Median waiting time (weeks) of P1 cases 5 5 - 3 + 66.7%
Median waiting time (weeks) of P2 cases 24 26 - 7.7% 18 + 33.3%
# 90 percentile waiting time (weeks) of Routine cases 110 116 - 5.2% 85 + 29.4%
th
Ultrasonography
% of urgent cases with examination done within 24 hours 94.3% 94.5% - 0.1%pt 94.3% +§
Median waiting time (weeks) of P1 cases 4 2 + 100.0% 4 -
Median waiting time (weeks) of P2 cases 30 26 + 15.4% 38 - 21.1%
# 90 percentile waiting time (weeks) of Routine cases 144 155 - 7.1% 123 + 17.1%
th
Mammogram
Median waiting time (weeks) of P1 cases 1 1 - 1 -
Median waiting time (weeks) of P2 cases 20 25 - 22.0% 20 - 2.5%
# 90 percentile waiting time (weeks) of Routine cases 109 184 - 40.8% 100 + 9.0%
th
Blue > 5% / 5%pt above Overall HA / previous period
Remark: Green > 5% / 5%pt below Overall HA / previous period
Appendices - B. Hospital Statistical Report
# with graph presented