
Page 50 - FOR FLIP BOOK [single page]Cluster report 2018-2020 (1)
P. 50
Current period Previous period
NTEC Overall HA Variance from NTEC
Apr 2019 - Mar 2020 Overall HA Apr 2018 - Mar 2019 Variance
A B C = (A - B) or D E = (A - D) or
(A - B) / B (A - D) / D
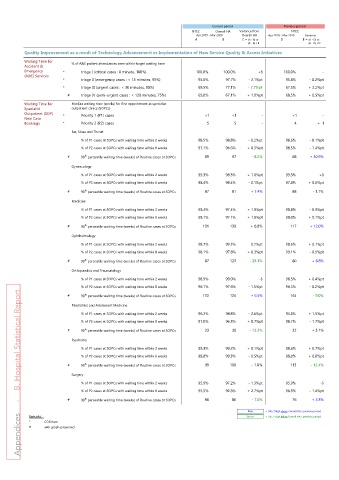
Quality Improvement as a result of Technology Advancement or Implementation of New Service Quality & Access Initiatives
Waiting Time for
Accident & % of A&E patient attendances seen within target waiting time
Emergency * triage I (critical cases : 0 minute, 100%) 100.0% 100.0% +§ 100.0% -
(A&E) Services
* triage II (emergency cases : < 15 minutes, 95%) 95.6% 97.7% - 2.1%pt 95.8% - 0.2%pt
* triage III (urgent cases : < 30 minutes, 90%) 69.5% 77.1% - 7.7%pt 67.3% + 2.2%pt
# triage IV (semi-urgent cases : < 120 minutes, 75%) 69.0% 67.1% + 1.9%pt 68.5% + 0.5%pt
Waiting Time for Median waiting time (weeks) for first appointment at specialist
Specialist outpatient clinics (SOPCs)
Outpatient (SOP) * Priority 1 (P1) cases <1 <1 - <1 -
New Case
Bookings * Priority 2 (P2) cases 5 5 - 4 + 1
Ear, Nose and Throat
% of P1 cases at SOPCs with waiting time within 2 weeks 98.5% 98.8% - 0.2%pt 98.6% - 0.1%pt
% of P2 cases at SOPCs with waiting time within 8 weeks 97.1% 96.6% + 0.5%pt 98.5% - 1.4%pt
# 90 percentile waiting time (weeks) of Routine cases at SOPCs 89 97 - 8.2% 68 + 30.9%
th
Gynaecology
% of P1 cases at SOPCs with waiting time within 2 weeks 99.3% 98.3% + 1.0%pt 99.3% +§
% of P2 cases at SOPCs with waiting time within 8 weeks 98.4% 98.4% - 0.1%pt 97.8% + 0.6%pt
# 90 percentile waiting time (weeks) of Routine cases at SOPCs 87 81 + 7.4% 88 - 1.1%
th
Medicine
% of P1 cases at SOPCs with waiting time within 2 weeks 98.4% 97.4% + 1.0%pt 98.8% - 0.3%pt
% of P2 cases at SOPCs with waiting time within 8 weeks 98.1% 97.1% + 1.0%pt 98.0% + 0.1%pt
# 90 percentile waiting time (weeks) of Routine cases at SOPCs 131 130 + 0.8% 117 + 12.0%
th
Ophthalmology
% of P1 cases at SOPCs with waiting time within 2 weeks 98.7% 99.3% - 0.7%pt 98.6% + 0.1%pt
% of P2 cases at SOPCs with waiting time within 8 weeks 98.1% 97.8% + 0.3%pt 99.1% - 0.9%pt
th
# 90 percentile waiting time (weeks) of Routine cases at SOPCs 87 123 - 29.3% 80 + 8.8%
Orthopaedics and Traumatology
% of P1 cases at SOPCs with waiting time within 2 weeks 98.9% 99.0% -§ 98.5% + 0.4%pt
% of P2 cases at SOPCs with waiting time within 8 weeks 96.1% 97.6% - 1.5%pt 96.3% - 0.2%pt
Appendices - B. Hospital Statistical Report
th
# 90 percentile waiting time (weeks) of Routine cases at SOPCs 132 124 + 6.5% 145 - 9.0%
Paediatrics and Adolescent Medicine
% of P1 cases at SOPCs with waiting time within 2 weeks 96.2% 98.8% - 2.6%pt 94.6% + 1.5%pt
% of P2 cases at SOPCs with waiting time within 8 weeks 97.0% 96.3% + 0.7%pt 98.7% - 1.7%pt
th
# 90 percentile waiting time (weeks) of Routine cases at SOPCs 33 38 - 13.2% 32 + 3.1%
Psychiatry
% of P1 cases at SOPCs with waiting time within 2 weeks 99.3% 99.2% + 0.1%pt 98.6% + 0.7%pt
% of P2 cases at SOPCs with waiting time within 8 weeks 98.8% 99.3% - 0.5%pt 98.0% + 0.8%pt
# 90 percentile waiting time (weeks) of Routine cases at SOPCs 99 100 - 1.0% 113 - 12.4%
th
Surgery
% of P1 cases at SOPCs with waiting time within 2 weeks 95.9% 97.2% - 1.3%pt 95.9% -§
% of P2 cases at SOPCs with waiting time within 8 weeks 95.5% 92.8% + 2.7%pt 96.9% - 1.4%pt
th
# 90 percentile waiting time (weeks) of Routine cases at SOPCs 80 86 - 7.0% 76 + 5.3%
Blue > 5% / 5%pt above Overall HA / previous period
Remarks: Green > 5% / 5%pt below Overall HA / previous period
* COR item
# with graph presented