Page 45 - FOR FLIP BOOK [single page]Cluster report 2018-2020 (1)
P. 45

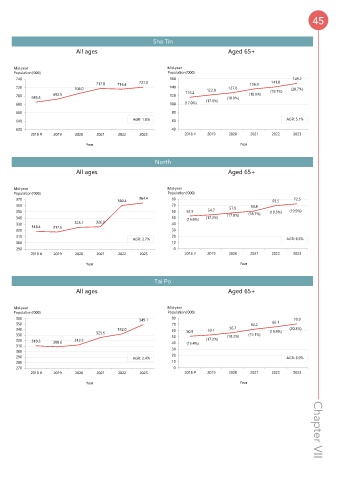
AGR : Annual Growth Rate (AGR) from 2018 to 2023
                                                                           (  ) : Percentage out of total population is shown in brackets
                                                Sha Tin,North & Tai Po
                            All ages
                                                                                 Aged 65+
      Mid-year
                                                            Mid-year
                                                            Population('000)
      Population('000)
                                                                                                        292.6
                                                             300
      1,460
                                                 1,434.5
                                                                                                276.6
      1,440
                                                             280
                                                                                                       (20.4%)
                                          1,408.8
                                                                                         259.0
      1,420
                                                                                                (19.6%)
                                                             260
      1,400
                                                                                 241.6
                                                                                        (18.9%)
                                  1,369.3
                                                                          229.8
      1,380
                                                             240
                                                                  220.0
                           1,343.3
      1,360
                                                                                 (18.0%)
                                                             220
                                                                         (17.4%)
      1,340
                   1,318.7
            1,314.4
                                                                  (16.7%)
      1,320
                                                             200
                                                                                                      AGR: 5.9%
      1,300
                                                AGR: 1.8%
                                                             180
      1,280 Population Projection in Catchment Districts of NTEC, 2018 - 2023
      1,260                                                  160
            2018 #  2019   2020    2021    2022   2023            2018 #  2019   2020    2021   2022    2023
                                                                                                               45
                               Year                                                  Year
                                                       Sha Tin
                            All ages                                             Aged 65+
      Mid-year                                              Mid-year
      Population('000)                                      Population('000)
       740                                                   160                                        149.2
                                   717.8  716.4   721.0                                  136.0  141.0
       720                 706.0                             140          122.0  127.0          (19.7%)  (20.7%)
       700  685.5   692.5                                    120  116.2          (18.0%)  (18.9%)
       680                                                   100  (17.0%)  (17.6%)
       660                                                   80
       640                                      AGR: 1.0%    60                                       AGR: 5.1%
       620                                                   40
            2018 #  2019   2020    2021    2022   2023            2018 #  2019   2020    2021   2022    2023
                               Year                                                  Year
                                                       North
                            All ages                                             Aged 65+
      Mid-year                                              Mid-year
      Population('000)                                      Population('000)
       370                                360.4   364.4      80                                  69.5   72.5
       360                                                   70                   57.9   60.8
       350                                                   60   52.9    54.7          (18.7%)  (19.3%)  (19.9%)
       340                                                   50    (16.6%)  (17.2%)  (17.8%)
       330  318.4          325.1   326.0                     40
       320          317.6                                    30
       310                                      AGR: 2.7%    20                                       AGR: 6.5%
       300                                                   10
       290                                                    0
            2018 #  2019   2020    2021    2022   2023            2018 #  2019   2020    2021   2022    2023
                               Year                                                  Year
                                                       Tai Po
                            All ages                                             Aged 65+
      Mid-year                                              Mid-year
      Population('000)                                      Population('000)
       360                                        349.1      80                                         70.9
       350                                                   70                          62.2    66.1
       340                                332.0              60   50.9    53.1    56.7          (19.9%)  (20.3%)
       330                         325.5                     50                  (18.2%)  (19.1%)
       320  310.5   308.6  312.2                             40    (16.4%)  (17.2%)
       310
       300                                                   30
       290                                      AGR: 2.4%    20                                       AGR: 6.9%
       280                                                   10
       270                                                    0
            2018 #  2019   2020    2021    2022   2023            2018 #  2019   2020    2021   2022    2023
                               Year                                                  Year                      Chapter VII
   40   41   42   43   44   45   46   47   48   49   50