
Page 46 - FOR FLIP BOOK [single page]Cluster report 2018-2020 (1)
P. 46
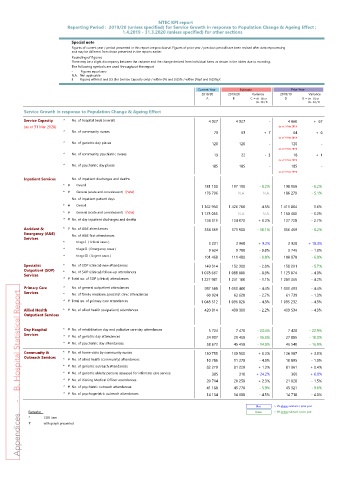
NTEC KPI report
                         Reporting Period :  2019/20 (unless specified) for Service Growth in response to Population Change & Ageing Effect ;
                                            1.4.2019 - 31.3.2020 (unless specified) for other sections

                          Special note
                          Figures of current year / period presented in this report are provisional. Figures of prior year / previous period have been revised after data reprocessing
                          and may be different from those presented in the reports earlier.
                          Rounding of figures
                          There may be a slight discrepancy between the variance and the change derived from individual items as shown in the tables due to rounding.
                          The following symbols are used throughout the report
                          -         Figures equal zero
                          N.A.   Not applicable
                          §        Figures within 0 and 0.5 (for Service Capacity only) / within 0% and 0.05% / within 0%pt and 0.05%pt
                                                                       Current Year  Estimate          Prior Year
                                                                        2019/20  2019/20  Variance  2018/19  Variance
                                                                         A         B     C = (A - B) or  D  E = (A - D) or
                                                                                                  (A - B) / B           (A - D) / D
         Service Growth in response to Population Change & Ageing Effect
         Service Capacity  *  No. of hospital beds (overall)               4 927     4 927     -       4 860   +  67
         (as at 31 Mar 2020)                                                                       (as at 31 Mar 2019)
                       *  No. of community nurses                            70        63     +  7       64     +  6
                                                                                                   (as at 31 Mar 2019)
                       *  No. of geriatric day places                        120      120      -         120      -
                                                                                                   (as at 31 Mar 2019)
                       *  No. of community psychiatric nurses                19        22     -  3       18     +  1
                                                                                                   (as at 31 Mar 2019)
                       *  No. of psychiatric day places                      185      185      -         185      -
                                                                                                   (as at 31 Mar 2019)
         Inpatient Services  No. of inpatient discharges and deaths
                       * #  Overall                                      181 100   197 190  - 8.2%   190 956  - 5.2%
                       * #  General (acute and convalescent)  (new)      176 796     N.A.    N.A.    186 279  - 5.1%
                          No. of inpatient patient days
                       * #  Overall                                     1 362 950  1 426 700  - 4.5%  1 413 804  - 3.6%
                       * #  General (acute and convalescent)  (new)     1 123 053    N.A.    N.A.   1 160 460  - 3.2%
                       * # No. of day inpatient discharges and deaths    124 319   124 070  + 0.2%   127 728  - 2.7%
         Accident &    * # No. of A&E attendances                        334 359   371 900  - 10.1%   356 459  - 6.2%
         Emergency (A&E)  No. of A&E first attendances
         Services
                       *    triage I  ( Critical cases )                   3 231     2 960  + 9.2%     2 928  + 10.3%
                       *    triage II  ( Emergency cases )                 9 624     9 700  - 0.8%     9 746  - 1.3%
                       *    triage III  ( Urgent cases )                 101 468   111 480  - 9.0%   108 970  - 6.9%
         Specialist    *  No. of SOP (clinical) new attendances          149 314   152 300  - 2.0%   158 291  - 5.7%
         Outpatient (SOP)  *  No. of SOP (clinical) follow-up attendances  1 078 667  1 088 800  - 0.9%  1 123 074  - 4.0%
         Services
                       * # Total no. of SOP (clinical) attendances      1 227 981  1 241 100  - 1.1%  1 281 365  - 4.2%
         Primary Care  *  No. of general outpatient attendances          987 588  1 033 400  - 4.4%  1 033 493  - 4.4%
         Appendices     -    B. Hospital Statistical Report
         Services      *  No. of family medicine specialist clinic attendances   60 924   62 620  - 2.7%   61 739  - 1.3%
                       * # Total no. of primary care attendances        1 048 512  1 096 020  - 4.3%  1 095 232  - 4.3%
         Allied Health  * # No. of allied health (outpatient) attendances   420 814   430 300  - 2.2%   439 534  - 4.3%
         Outpatient Services


         Day Hospital  * # No. of rehabilitation day and palliative care day attendances   5 724   7 470  - 23.4%   7 428  - 22.9%
         Services      * # No. of geriatric day attendances               24 937    29 450  - 15.3%   27 805  - 10.3%
                       * # No. of psychiatric day attendances             38 673    45 450  - 14.9%   46 540  - 16.9%
         Community &   * # No. of home visits by community nurses        130 755   130 500  + 0.2%   126 987  + 3.0%
         Outreach Services  * # No. of allied health (community) attendances   10 786   11 270  - 4.3%   10 895  - 1.0%
                       * # No. of geriatric outreach attendances          82 270    81 220  + 1.3%    81 961  + 0.4%
                       * # No. of geriatric elderly persons assessed for infirmary care service    385    310  + 24.2%    360  + 6.9%
                       * # No. of Visiting Medical Officer attendances    20 714    20 250  + 2.3%    21 028  - 1.5%
                       * # No. of psychiatric outreach attendances        41 168    43 770  - 5.9%    45 521  - 9.6%
                       * # No. of psychogeriatric outreach attendances    14 134    14 800  - 4.5%    14 718  - 4.0%

                                                                                           Blue  > 5% above estimate / prior year
           Remarks:                                                                        Green  > 5% below estimate / prior year
           *         COR item
           #         with graph presented