Page 44 - FOR FLIP BOOK [single page]Cluster report 2018-2020 (1)
P. 44

New Territories East Cluster
         Appendices     -     A. Financial Report
           Notes to the Financial Statements (Continued)

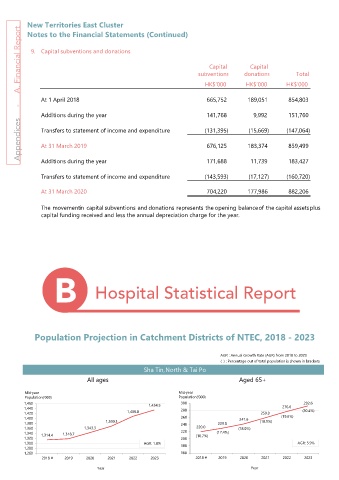
            9. Capital subventions and donations


                                                                          Capital        Capital
                                                                       subventions     donations         Total

                                                                         HK$’000       HK$’000        HK$’000

               At 1 April 2018                                                   665,752              189,051              854,803

               Additions during the year                                         141,768                   9,992              151,760


               Transfers to statement of income and expenditure                (131,395)              (15,669)            (147,064)

               At 31 March 2019                                                  676,125              183,374              859,499

               Additions during the year                                         171,688                 11,739              183,427


               Transfers to statement of income and expenditure                (143,593)              (17,127)            (160,720)

               At 31 March 2020                                                  704,220              177,986              882,206


               The movementin capital subventions and donations represents the opening balanceof the capital assetsplus
               capital funding received and less the annual depreciation charge for the year.


                    B             Hospital Statistical Report


             Population Projection in Catchment Districts of NTEC, 2018 - 2023


                                                                              AGR : Annual Growth Rate (AGR) from 2018 to 2023
                                                                              (  ) : Percentage out of total population is shown in brackets
                                                    Sha Tin,North & Tai Po
                                All ages                                             Aged 65+


          Mid-year                                              Mid-year
          Population('000)                                      Population('000)
          1,460                                      1,434.5     300                                        292.6
          1,440                                                  280                                276.6  (20.4%)
          1,420                               1,408.8                                        259.0
          1,400                                                  260                 241.6          (19.6%)
          1,380                       1,369.3                    240          229.8         (18.9%)
          1,360                1,343.3                                220.0          (18.0%)
          1,340  1,314.4  1,318.7                                220  (16.7%)  (17.4%)
          1,320                                                  200
          1,300                                     AGR: 1.8%                                             AGR: 5.9%
          1,280                                                  180
          1,260                                                  160
                2018 #  2019   2020    2021   2022    2023            2018 #  2019   2020    2021   2022    2023
                                   Year                                                  Year

                                                           Sha Tin

                                All ages                                             Aged 65+


          Mid-year                                              Mid-year
          Population('000)                                      Population('000)
           740                                                   160                                        149.2
                                       717.8  716.4   721.0                                  136.0  141.0
           720                 706.0                             140          122.0  127.0          (19.7%)  (20.7%)
           700  685.5   692.5                                    120  116.2          (18.0%)  (18.9%)
           680                                                   100  (17.0%)  (17.6%)
           660                                                   80
           640                                      AGR: 1.0%    60                                       AGR: 5.1%
           620                                                   40
                2018 #  2019   2020    2021   2022    2023            2018 #  2019   2020    2021   2022    2023
                                   Year                                                  Year


                                                           North
                                All ages                                             Aged 65+


          Mid-year                                              Mid-year
          Population('000)                                      Population('000)
           370                                360.4   364.4      80                                 69.5    72.5
           360                                                   70                  57.9    60.8
           350                                                   60   52.9    54.7          (18.7%)  (19.3%)  (19.9%)
           340                                                   50   (16.6%)  (17.2%)  (17.8%)
           330  318.4   317.6  325.1   326.0                     40
           320                                                   30
           310                                      AGR: 2.7%    20                                       AGR: 6.5%
           300                                                   10
           290                                                    0
                2018 #  2019   2020    2021   2022    2023            2018 #  2019   2020    2021   2022    2023

                                   Year                                                  Year

                                                           Tai Po
                                All ages                                             Aged 65+


          Mid-year                                              Mid-year
          Population('000)                                      Population('000)
           360                                        349.1      80                                         70.9
           350                                                   70                          62.2   66.1
           340                                332.0              60   50.9    53.1   56.7           (19.9%)  (20.3%)
           330                         325.5                     50                  (18.2%)  (19.1%)
           320  310.5   308.6  312.2                             40   (16.4%)  (17.2%)
           310
           300                                                   30
           290                                      AGR: 2.4%    20                                       AGR: 6.9%
           280                                                   10
           270                                                    0
                2018 #  2019   2020    2021   2022    2023            2018 #  2019   2020    2021   2022    2023

                                   Year                                                  Year
   39   40   41   42   43   44   45   46   47   48   49